


Key takeaways:
- A single departure can be flown up to two million different ways. Aircraft climb optimization should include at least four parameters: initial indicated airspeed (IAS), acceleration flight level, second IAS, and Climb Mach.
- Cost Index is fixed on one parameter. It’s built for cruise economics. Machine learning models are trained on each aircraft's quick access recorder (QAR) data and select the profile that fits the specific tail, while verifying the fuel saving on every flight.
- In 2025 this architecture saved 59,011 tonnes of fuel across 1,137 A320 family aircraft, an average of 73 kg per departure.
Take a single departure. Hold the aircraft, the weight, the runway, and the weather fixed. There are still up to two million ways to fly the climb.
Climb optimization comes down to many parameters, but let’s focus on four: initial IAS, acceleration flight level, second IAS, and Climb Mach. Four parameters open up far more than four choices. Each takes a range of values. Each interacts with the others. Run the combinations and a single flight can have up to two million possible climb profiles.
Most tools do not search that space. They apply one fixed profile.
What if you could find the best profile in two million, before the aircraft pushes back? You'd need an optimization engine fast enough to search, a model accurate enough to trust, and a way to analyze and compare with reality after the fact.
This is how those three pieces fit together.
Why can't Cost Index truly optimize the climb?
Evaluate every one of two million candidate profiles, one at a time, and the calculation runs long past pushback. That single fact is what separates this problem from the one Cost Index was built to solve.
Cost Index gives one answer by design: the point on a time-versus-fuel-cost curve that minimizes total cost for only two speed variables. For its original job, cruise speed economics, that is enough. The climb problem has four variables that impact each other. Adding two more dimensions doesn’t stretch the Cost Index method. It breaks it. The shape of the problem changes from a point on a plane to a search across a vast, interconnected space.
A true optimization engine never searches the whole space. Proprietary algorithms home in on near-optimal profiles while evaluating fewer than 1,000 candidates per flight, a tiny fraction of the full range, and still land close to the best result available. And the scale is the point worth keeping: a problem with up to two million candidates, solved in the minutes before departure, needed an engine built for it.
A fast search is only half the answer. The engine has to know what each candidate profile would actually cost in fuel. That number comes from a digital-twin model predicting climb dynamics.
Why do generic aircraft performance models get fuel burn wrong?
Manufacturer performance data assumes a generic aircraft in standard conditions. Think of the fuel economy figure on a car sticker, measured in a lab under controlled conditions. Put that car on a country road during a rainy day, a caravan attached to the back, with the wear and tear of the engine, and the number drifts. Aircraft performance models carry the same limit. Two things stay invisible to them, and both decide whether a climb profile is right for this specific tail.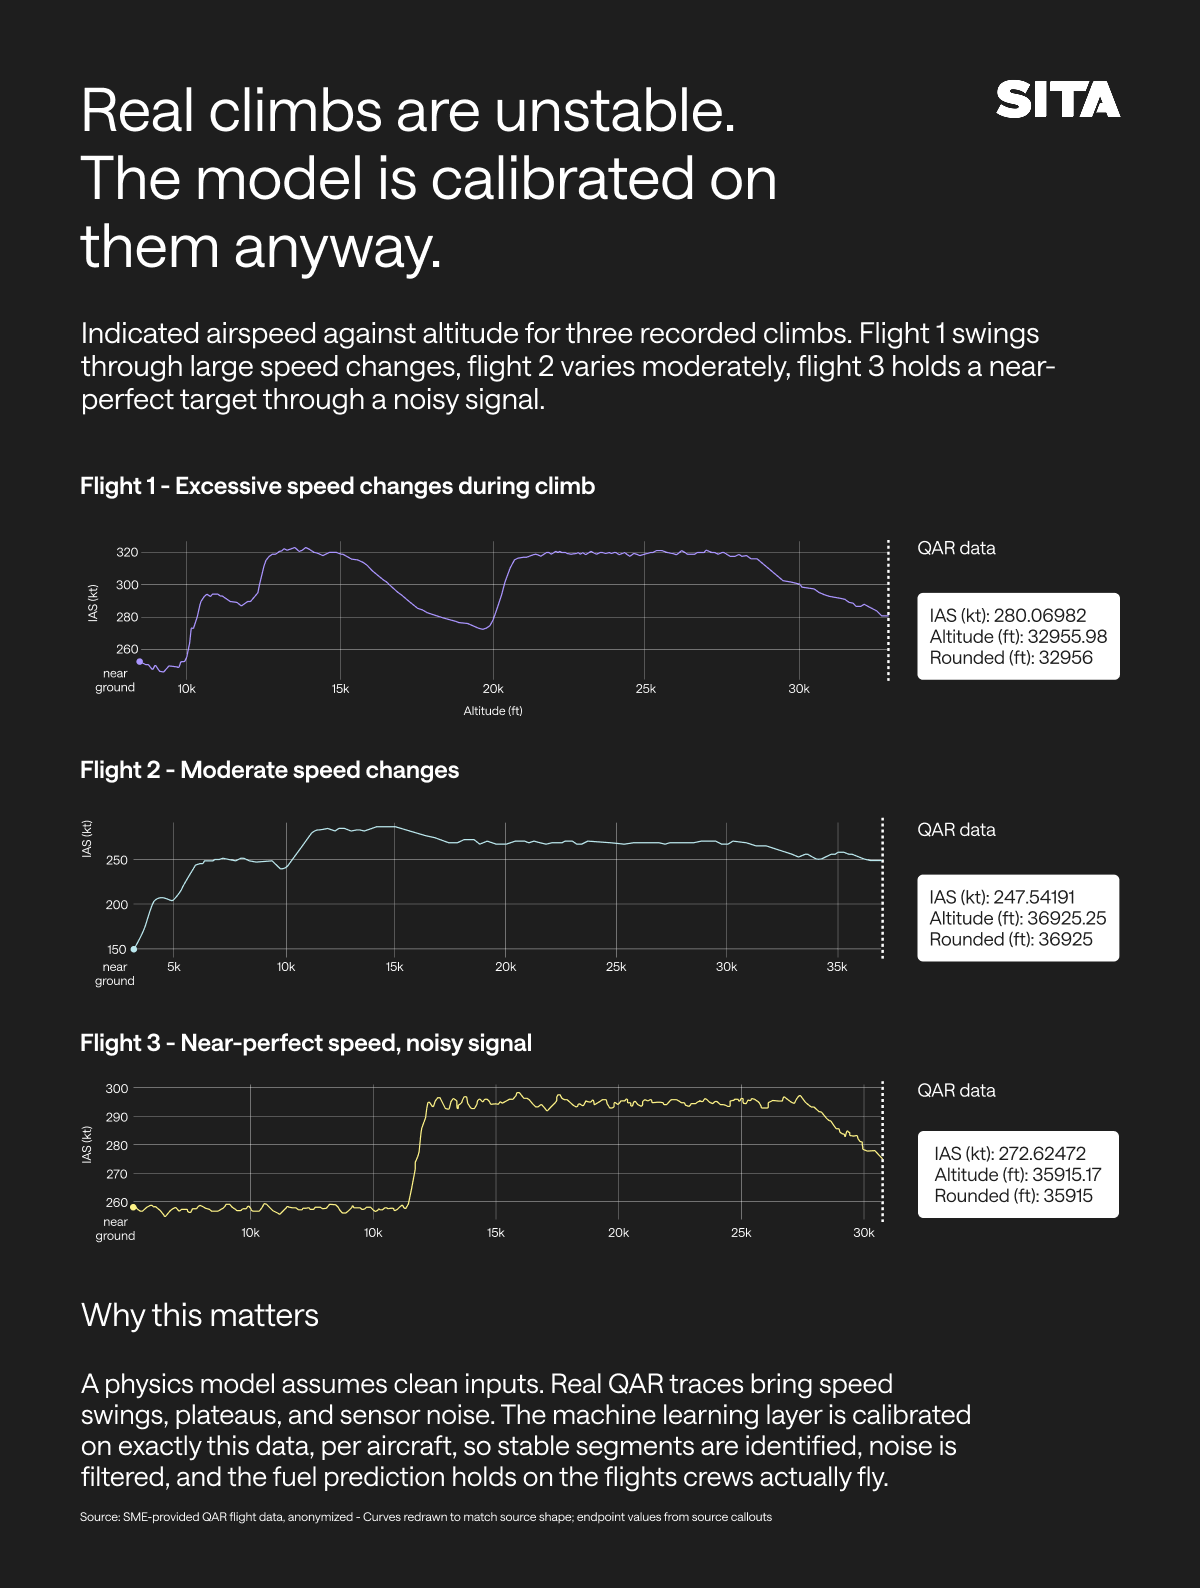
The first is wear. Engines and airframes degrade over their service life. Thrust, drag, and fuel burn rates all shift as an aircraft accumulates cycles. A generic model has no way to track that. The gap between book performance and what this aircraft does today shows up on every flight's recorded data.
The second is movement. Manufacturer models treat climb as a steady-state process at a constant target speed. Real climbs are not that tidy. QAR data, the 40-plus parameters captured on every flight, shows how differently the same aircraft type behaves from one departure to the next.
This is why a generic profile, however well calculated, optimizes for an aircraft that does not exist. QAR data fixes that. It gives the model engine and airframe performance as it is now, plus the real shape of the climb as it actually unfolds. A profile built on that data fits this tail in a way book figures cannot.
How does machine learning predict climb fuel burn?
The link between engine power and aircraft speed in the climb runs through the Flight Management System, which moves the control surfaces to hold the commanded speed. That control law is non-linear and specific to each aircraft. Clean equations cannot capture it without deep-diving on OEM proprietary data.
Machine learning can. It learns the behavior directly from the aircraft's own QAR history, holding the aircraft-specific complexity inside the prediction model instead of forcing it into a formula with many unknowns. The same approach keeps the model current: it is retrained every three to four months as new data arrives, so engine and airframe drift is absorbed continuously. The model choosing tomorrow's profile reflects what this aircraft is doing now, not what it did when it left the factory.
The same model that picks the profile also proves the saving
How are fuel savings verified flight by flight?
Every flight records what happened. None records what would have happened on a different profile. The reference climb, what the standard approach would have burned on this departure, on this day, with this aircraft, never flew. There was no number to put on it. That gap sat at the center of fuel optimization for years: you could fly a profile, but you could never see the one you passed up.
Because the machine learning model can predict fuel burn for any profile on this aircraft, it can predict the reference climb too, the one that never happened. That is what makes a verified, per-flight saving possible.
HOW THE SAVING IS CALCULATED, POST-FLIGHT
- Predict the fuel burned by the model profile up to its Top of Climb, reached at ground distance A.
- Predict the fuel the reference (ECON) profile would have burned up to its Top of Climb, reached at ground distance B. Typically B is further out than A.
- Add the fuel for the catch-up: the model flight flies on from A to B so both profiles are compared over the exact same ground distance.
- The saving is the difference in predicted fuel between the two profiles at that common point. The time delay, around 30 seconds, is calculated the same way. Both sides use model predictions, not the model flight's recorded data. The reference never flew, so it can only be predicted. Holding both profiles to the same method cancels any bias the model might introduce and keeps the comparison fair.
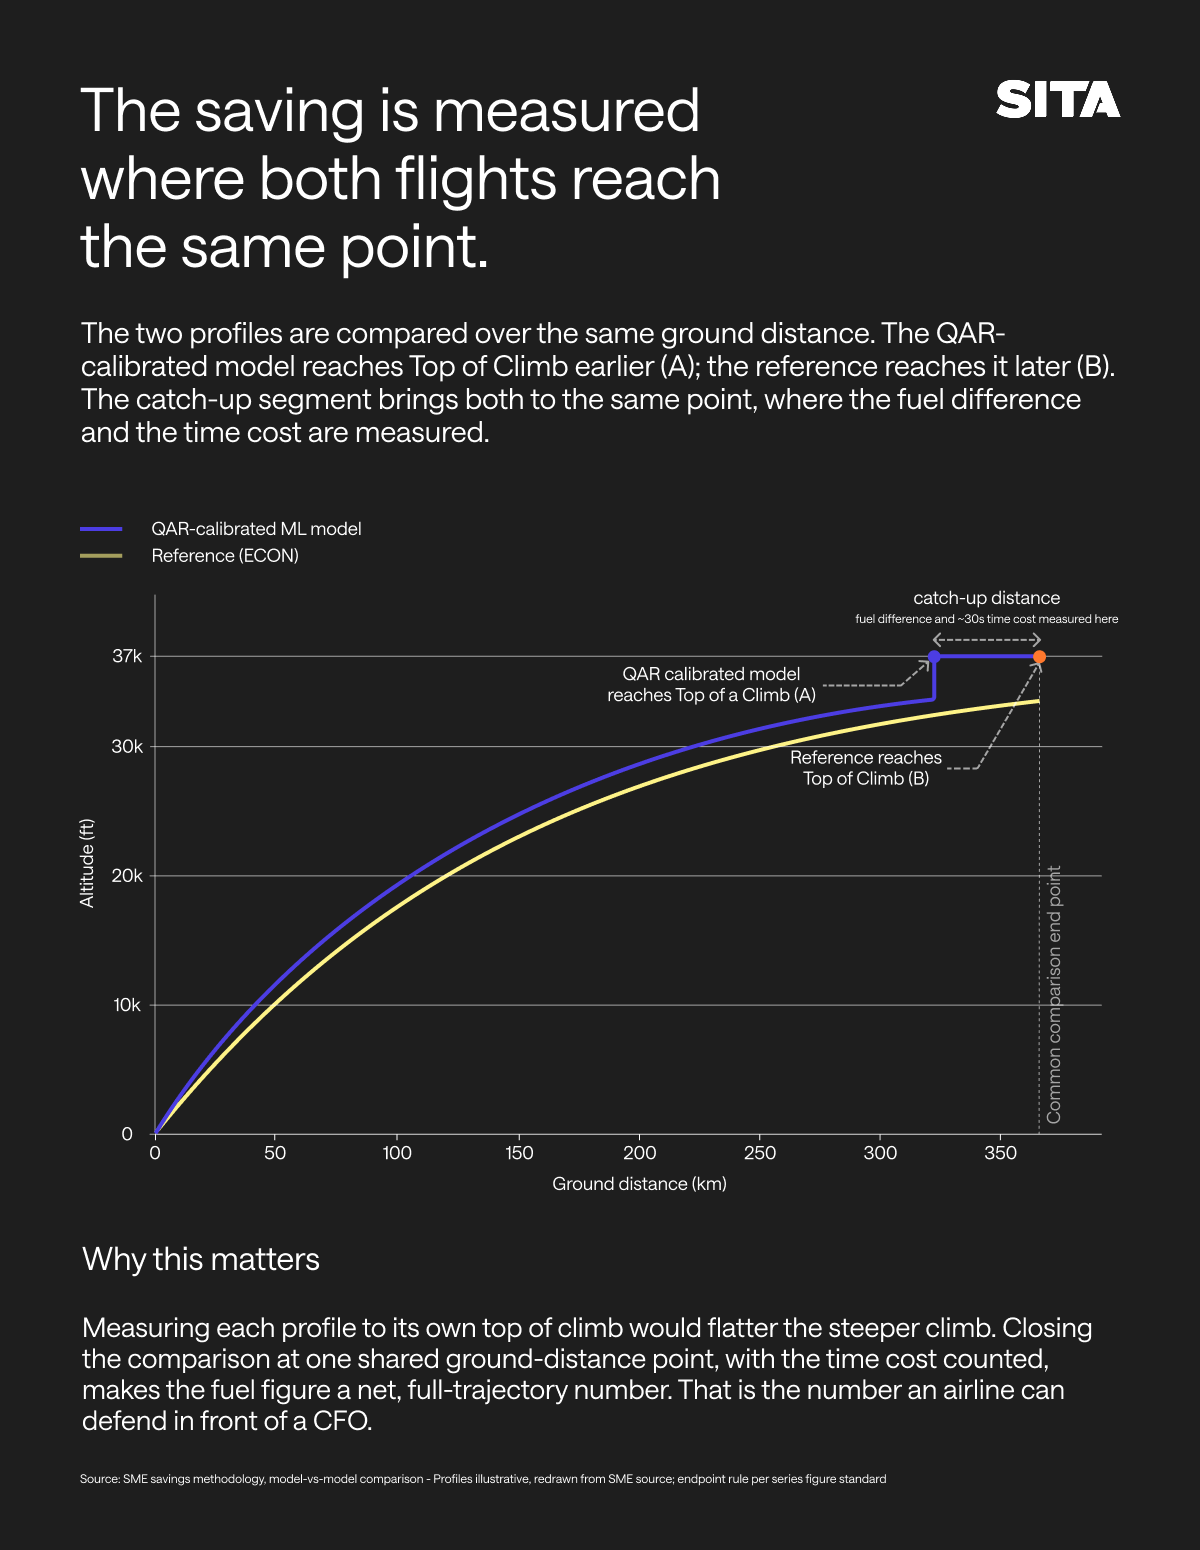
The output is a saving figure for each flight: verified, traceable, and produced by the same model that made the recommendation. Many tools in this space report savings as fleet averages or projections. This loop produces a number per flight, the kind that stands up to a CFO, an auditor, and the EU Green Claims Directive.
What should airlines ask of a climb optimization tool?
The architecture behind the 73 kg saving is now in the open. Three questions test whether a climb tool is built on the same foundation.
First: What performance data is the tool working from? Generic manufacturer data reflects an aircraft that no longer exists. The QAR data that describes your actual fleet already exists, recorded on every flight.
Second: How often does the model update? Engine and airframe performance drift continuously. A model retrained every three to four months keeps pace. A static model accumulates error with every cycle.
Third: Can the tool show the saving on a single flight? Flight by flight, against a baseline, over the same ground distance, with the time cost accounted for. A tool that cannot produce that number cannot stand behind the savings it reports.
Two million ways to fly the climb. One right answer for this aircraft, today, somewhere inside that space. Finding it is the fuel saving opportunity. Proving it is what turns a saving into a number you can report.
FAQs


