
When it comes to flight optimization, the cruise phase gets the attention. It’s the longest segment. Climb gets little. But climb is where the aircraft is heaviest and thrust is highest, and it’s where pilots have full control with no requirement to request ATC clearance. That’s exactly why climb presents an opportunity to save.
The savings are real and measurable. Across nearly 1.5 million Airbus A320 Family flights in 2025, optimizing the climb profile saved an average of 73 kg of fuel per departure. The savings come from a data-driven model that learns from each aircraft’s real performance history rather than generic manufacturer tables. At 73 kg per flight, that adds up to $48,800 per aircraft per year.
The tools that manage climb tend to adjust just one thing: speed. Climb is shaped by far more. The same profile flown by a heavier aircraft, into a headwind, or on a hot day burns fuel differently. A tool that ignores those conditions leaves savings on the table on every flight.
That’s the opportunity. The tool just needs to look at more than one factor.
The tool airlines use to optimize climb was built for a different problem.
Cost Index is a tool made to balance time cost against fuel cost in the cruise phase. When applied to climb, it controls just one parameter. Real climb optimization involves many more. The right tool will limit it to four because these enter cleanly into the Flight Management Computer: initial indicated airspeed (IAS), acceleration flight level (FL), second IAS, and Climb Mach.
The profile is also static. Every flight gets the same inputs. Every aircraft, on every departure, regardless of weight, wind, temperature, or the individual performance of that specific aircraft.
Think of how carmakers advertise fuel economy. The sticker promises something amazing, but get that new car on a winding mountain road, three kids and four suitcases in the back while it’s raining, and that fuel economy number goes out the window. OEM aircraft performance models carry the same constraint. They believe the showroom ads when real operations face real-world conditions.
The good news is, there’s a way to juggle all the parameters, to optimize fuel use during climb. Let’s get into the details. 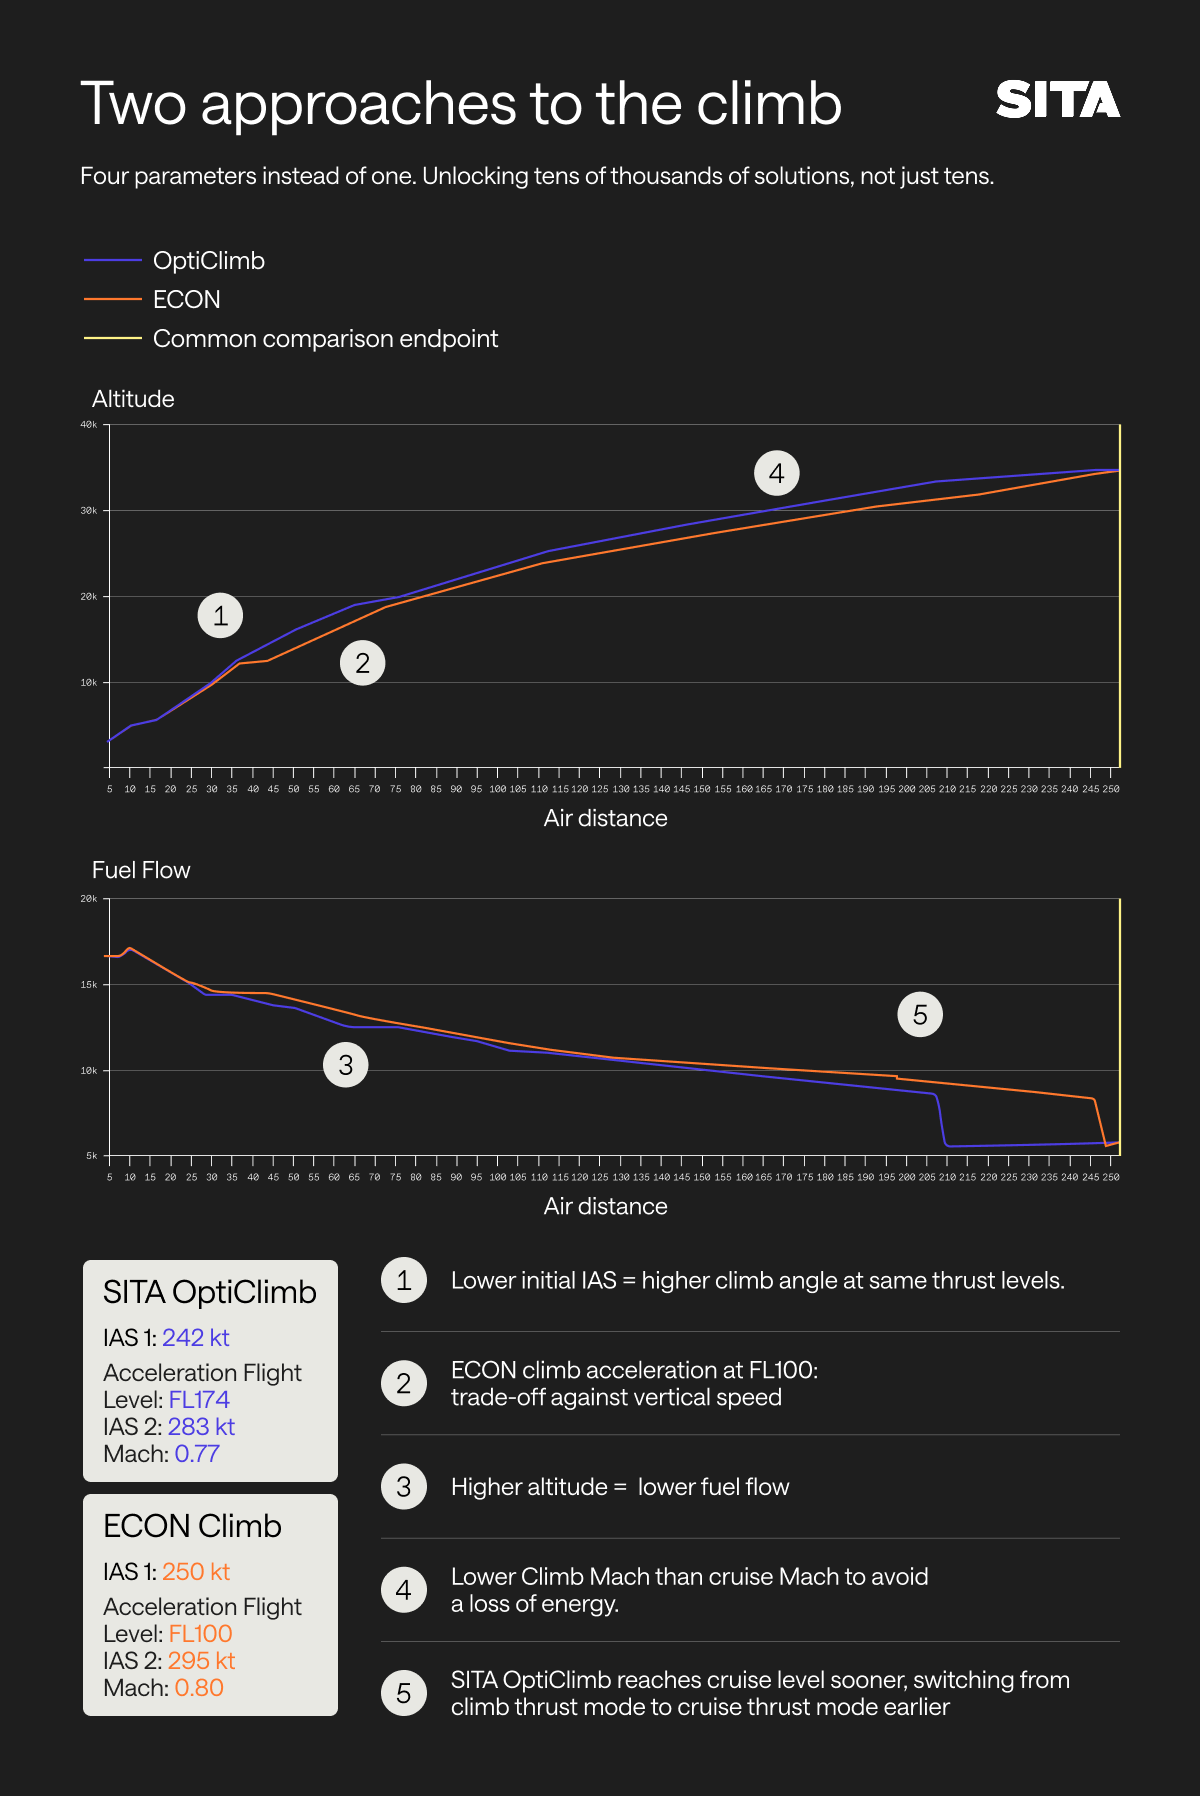
A standard OEM climb profile follows a fixed recipe. The aircraft climbs at 250 knots up to 10,000 feet, accelerates, then settles into an economy climb speed for the rest of the way up. That economy speed is calculated from the flight plan’s Cost Index, taking into account a limited set of inputs. The aircraft then accelerates to Cruise Mach at the crossover.
On the other hand, the right tool would recalculate all four parameters before each departure (for example: IAS 1 = 242 kt, acceleration at FL174, IAS 2 = 283 kt, Climb Mach = 0.77) using Digital Twin Machine-Learning performance models for each tail, and granular wind and temperature forecasts. The altitude profiles tell the story. The OEM profile shows a kink at FL100: the aircraft briefly trades vertical speed for horizontal as it accelerates. The data-driven profile delays that moment to a flight level higher than FL100. By then it has built a vertical separation. Higher altitude means lower air density, lower fuel flow, and the gap between the two fuel flow lines opens from there.
The moment all four parameters are live, conditions are exactly what determine the optimal combination. A wind gradient at FL180 that does not exist at FL120 changes the ideal transition point. A model that holds conditions constant cannot see what it is passing over.
Fuel prices and supply challenges make optimization urgent
This opportunity comes at a time when fuel prices are sky-high and supply constraints are on the horizon. Goldman Sachs estimates Europe's commercial jet fuel inventories will fall below the IEA's critical 23-day shortage threshold sometime in June.
In response, Lufthansa is cutting 20,000 short-haul flights through October, aiming to save 40,000 tonnes of jet fuel. SAS cancelled 1,000 flights in April; KLM reduced capacity. Four Italian airports capped short-haul aircraft at 2,000 liters of fuel on board, less than an hour of flying time for an A320.
Read those numbers against the opportunity for optimization during climb. Optimized climb won’t replace these decisions. It saves in the range of 1% of total fuel per flight. But at a fleet level the tonnes add up, and every percent cuts both CO2 and cost. Across 1,137 A320 Family aircraft flying an optimized climb in 2025, the saving reached 59,011 tonnes. When fuel is scarce and expensive, saving compounds on every departure. It is efficiency you capture whether or not you also cut capacity.
The potential savings: 73 kg per flight. $48,800 per aircraft per year.
We have seen these numbers in the real world, in real time. Profiles are compared to a common ground-distance endpoint, with time cost factored in. This is a full-trajectory figure, not a climb-only number that hides the downstream trade-offs.
CALCULATING THE SAVINGS
59,011 tonnes saved in 2025 ÷ 1,137 aircraft = 51.9 tonnes per aircraft per year
51.9 tonnes × 3.15 (CO₂ factor) = 163 tonnes of CO₂ per aircraft per year
51.9 tonnes × $941.07/tonne (IATA Fuel Monitor, June 2026) = $48,800 per aircraft per year
$48,800 × 100 aircraft = $4.9 million per year
$48,800 × 200 aircraft = $9.8 million per year
Source: IATA Fuel Monitor, global average ($941.07/tonne, June 2026). 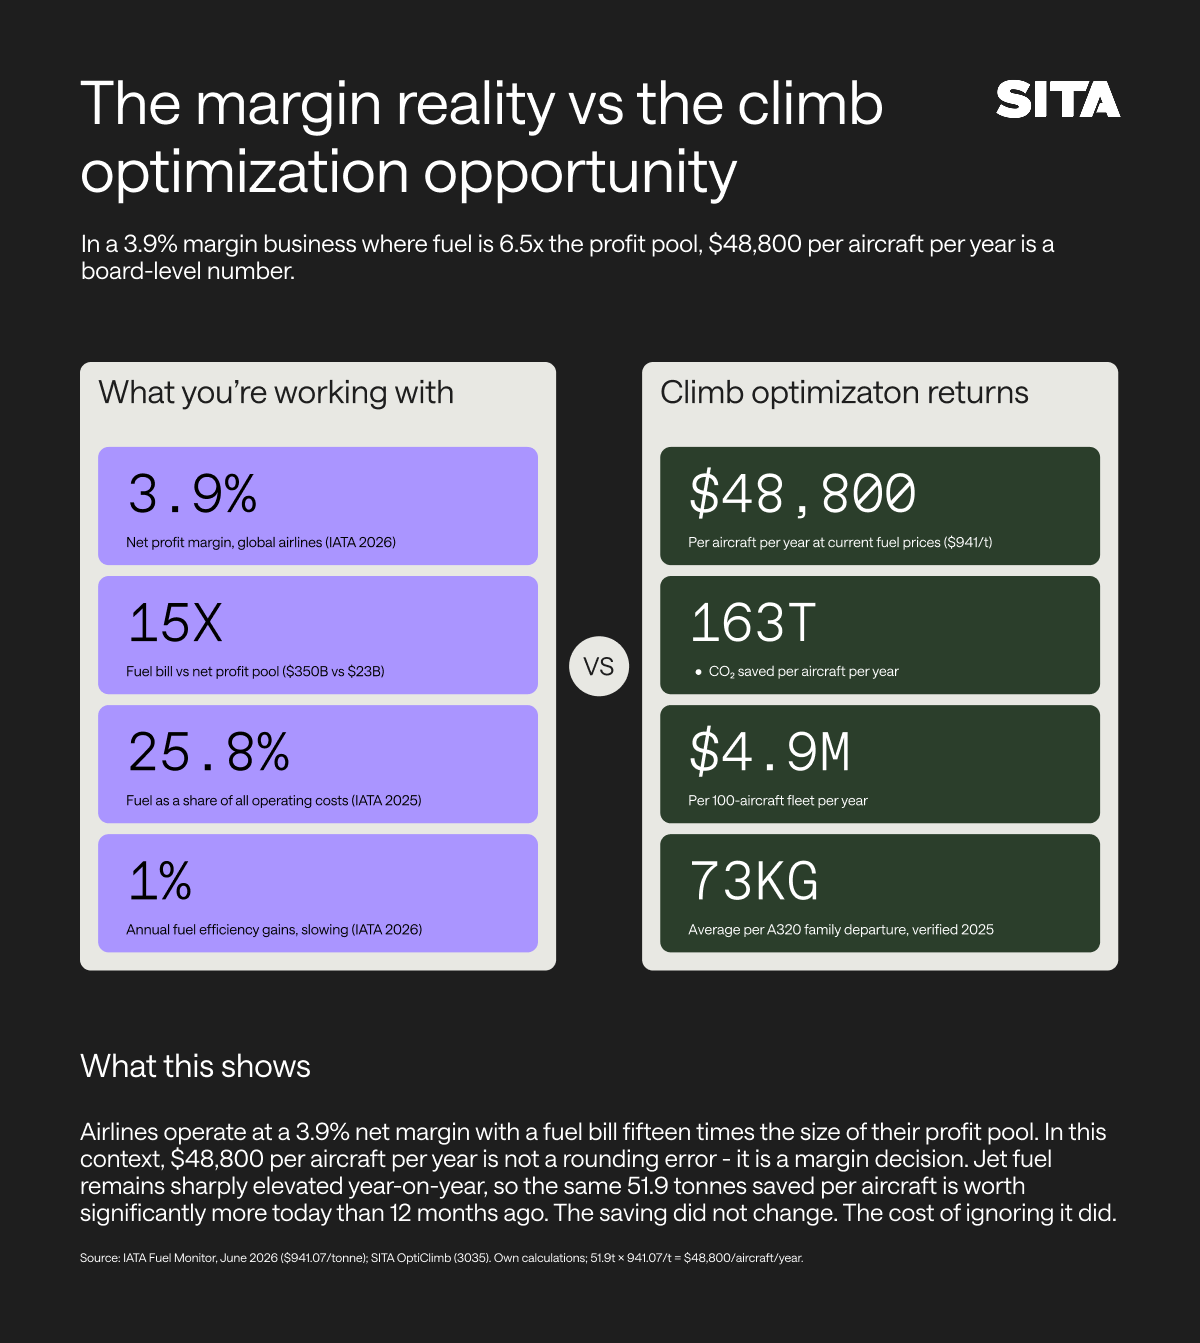
Jet fuel prices remain sharply elevated year-on-year, according to IATA Fuel Monitor. The same 51.9 tonnes saved per aircraft is worth more today than it was a year ago. The fuel saving did not change. The cost did.
To put it at board level: the industry’s global fuel bill is forecast to hit $350 billion in 2026, against a net profit of $23 billion. The fuel bill is roughly 15 times the total profit pool. Annual fuel efficiency gains are running at just 1% per year, with fleet renewal slowing.
At that margin, saving $48,800 per aircraft per year is an opportunity that can’t be ignored. 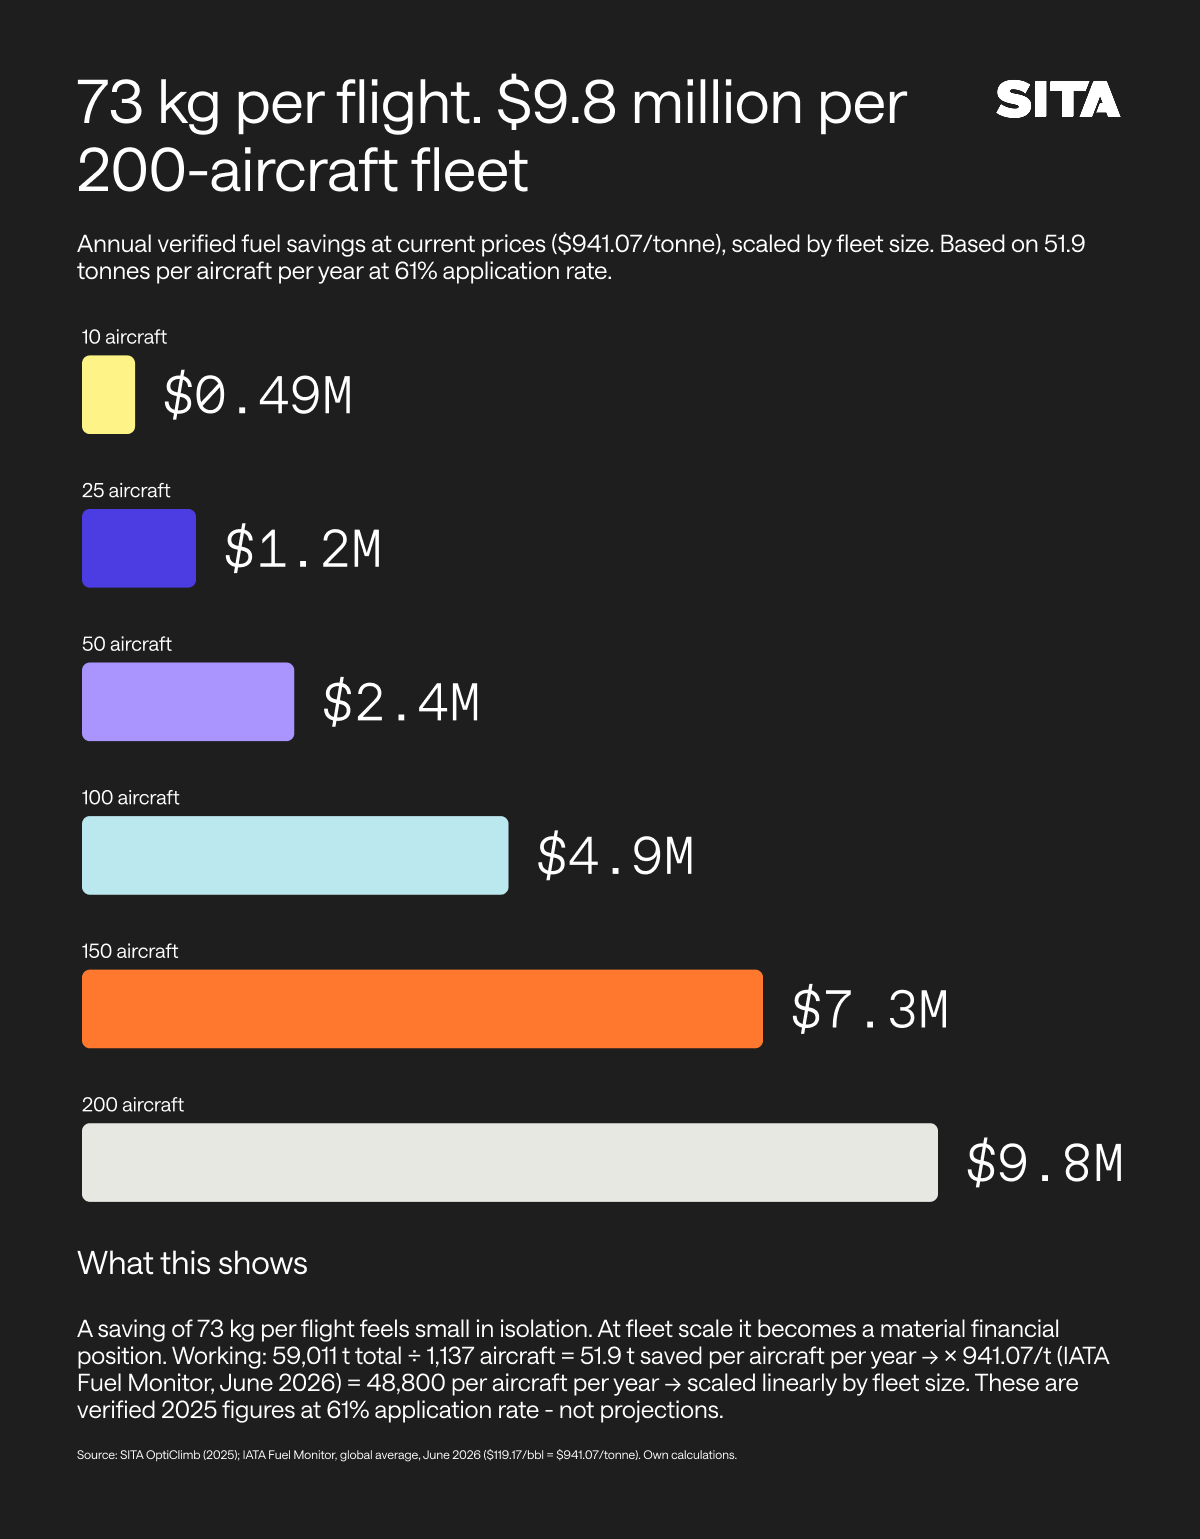
Two bonus benefits: no clearance required, with auditable results
Cruise optimization requires ATC to grant flight level changes and route shortcuts.
Descent optimization is also constrained by approach sequencing and ATC instruction.
Climb needs none of that. One set of speeds, calculated before departure, applied directly by the crew. No ATC clearances required. No external dependency. The phase airlines treat as most fixed is the one they can control most freely.
A 61% application rate across 2.9 million flights in 2025 confirms the opportunity. The more you optimize, the more you save.
Proven, auditable savings
Most in-flight optimization tools cannot produce verified results on a pre-flight basis. They cannot compare actual performance against a predicted baseline on a specific flight. The data-driven approach generates a prediction before departure, flies the flight, and compares the saving data of the two.
With the EU Green Claims Directive drawing a hard line between verified and estimated claims, auditable data is the difference between a claim you can publish and one you cannot.
What leaders can do
The argument is made. The numbers are sourced. Three things follow.
First, implement a climb optimization solution and measure savings. Some operators have never compared their standard profile against a multi-variable alternative on the same flight, to the same ground distance endpoint. That comparison is the starting point.
Second, use a tool that can verify its own results. Not estimate - verify. Flight by flight, against a baseline. If it cannot, the savings you are reporting are claims, not facts. In 2026, that distinction has legal weight.
Third, recognize that climb is the only efficiency lever on the table that needs nothing external. No ATC negotiation. No airspace coordination. No route changes. Every other lever has a dependency. This one does not.
The bottom line: fuel is costing airlines more than it needs to. The fix needs no ATC clearance, and the savings are proven.